
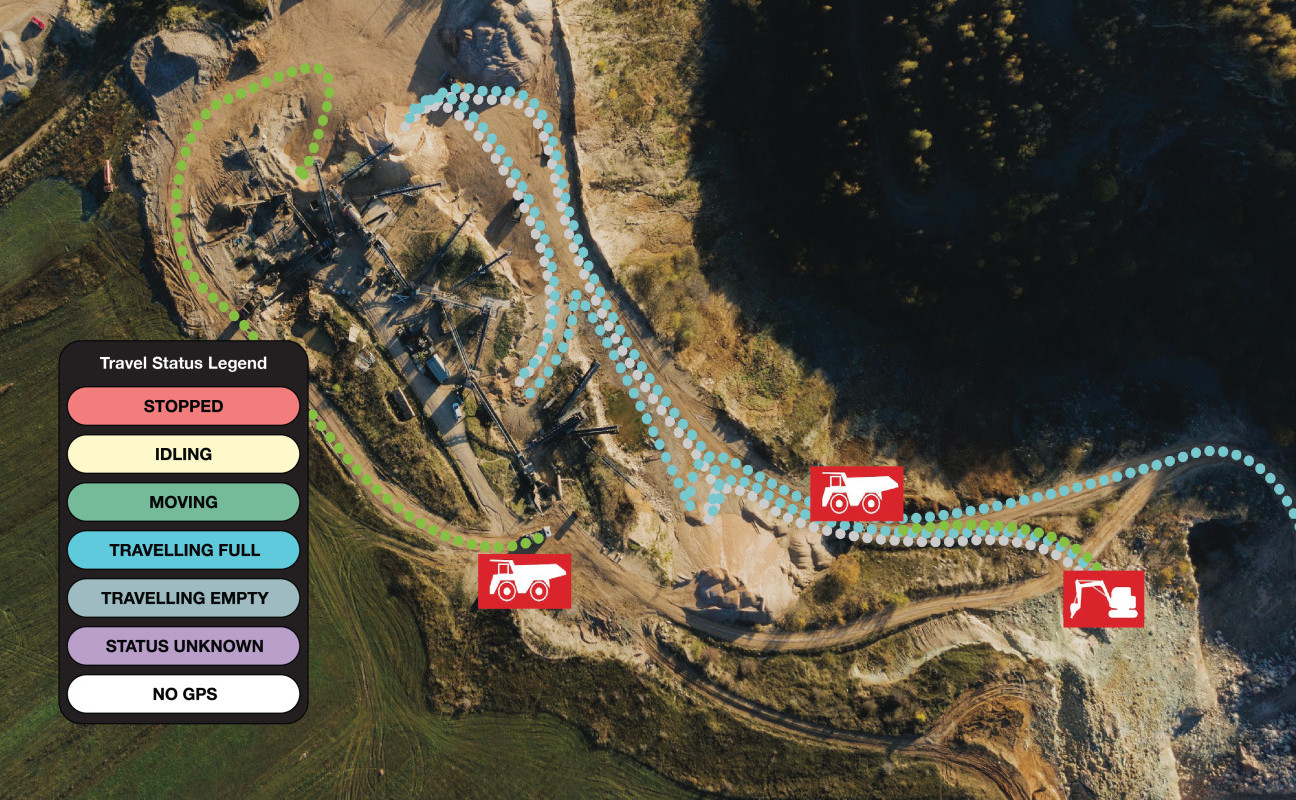
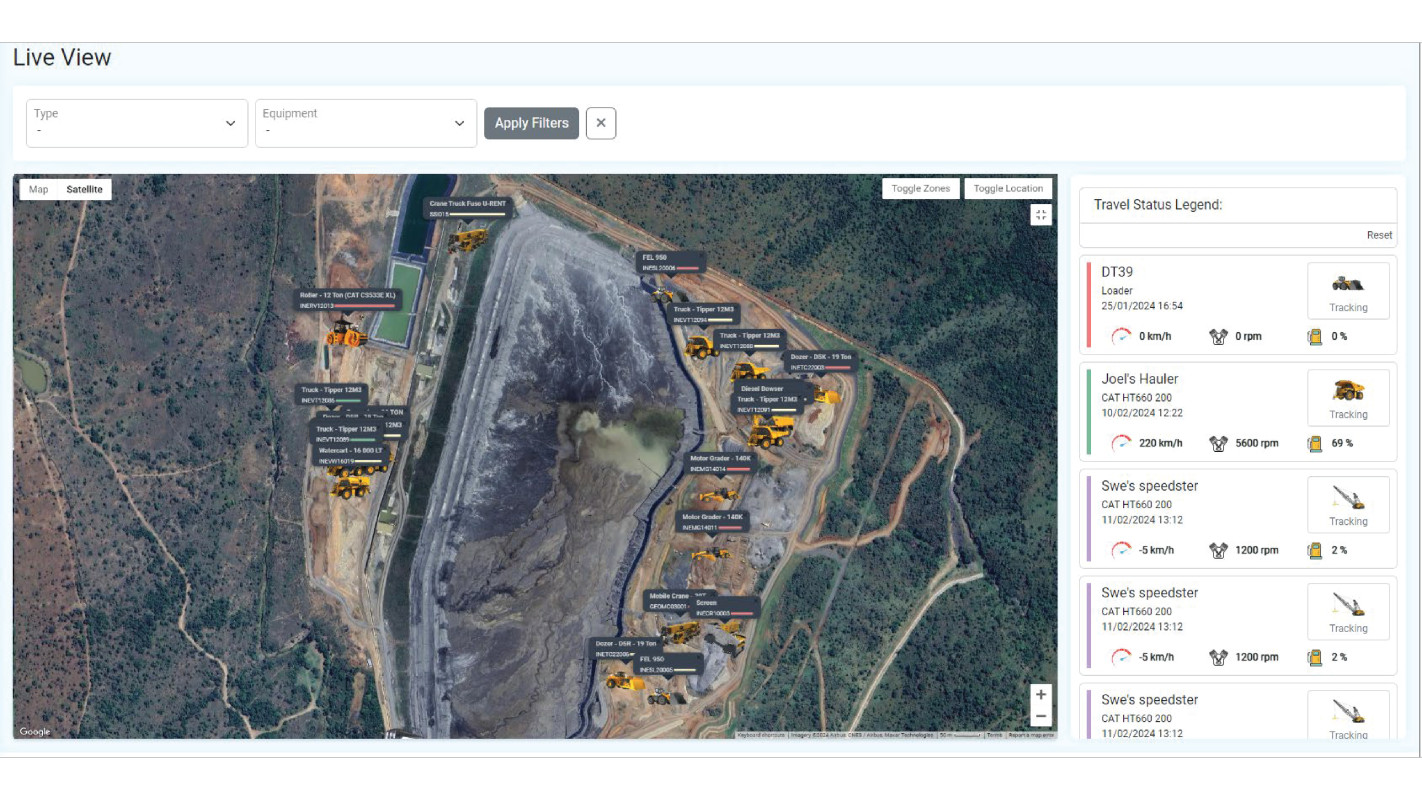
The location and status of the equipment are displayed visually on a map. The load and haul
operational zones and locations are pre set up based on the defined scope of the mine/quarry.
The equipment status is viewed by location and zone, enabling tracking of each piece of equipment.
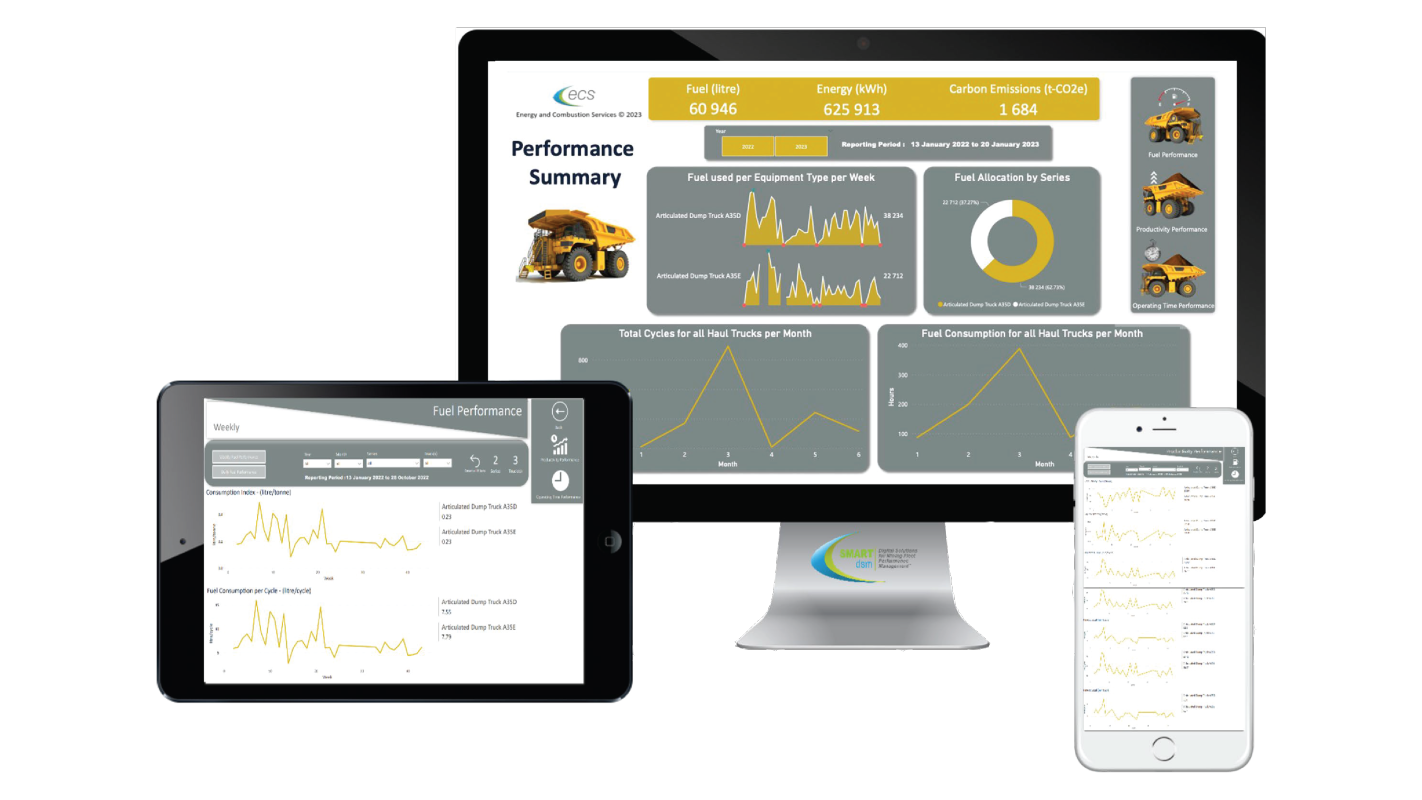
Performance Dashboards and Management Portals
SmartDSM’s Dashboard and performance reporting can be fully integrated with other
mining management systems. The integration of Power BI Summary Reports into the
SmartDSM portal facilitates a deeper understanding of the Energy and Productivity
performance of each piece of equipment.
Testimony
“We used SmartDSM to enable our managers to measure
aspects of Energy, Production, and Carbon Performance
within their control.
After implementing SmartDSM, a piece of hauling
equipment overturned on site due to driver negligence.
Through the analysis of raw equipment data and accurate
reporting, the ECS team was able to provide us with a
deep dive assessment of the driver’s behavioural patterns.
Thank you to ECS and their team for helping us improve
our production and reach our sustainability targets”
- A Major Contract Miner
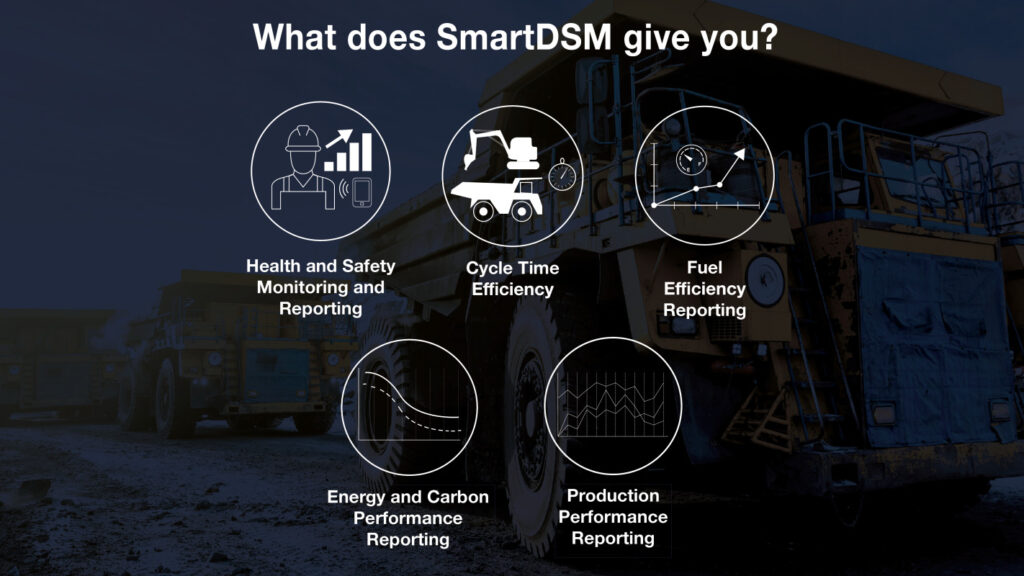
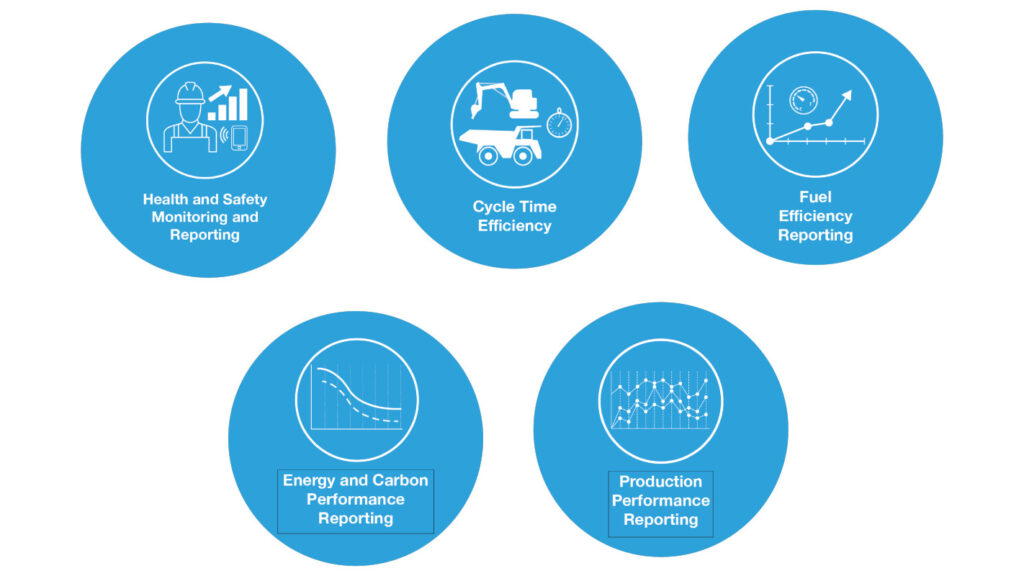
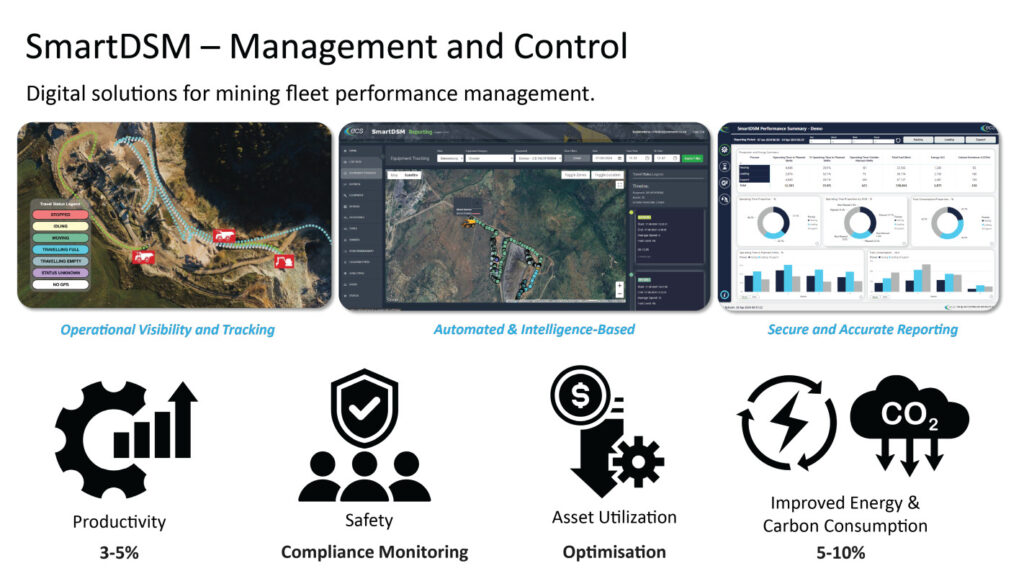
SmartDSM What does it give you?
Key Value Elements:
- Safety: Trends of these KPIs can be visualised and compliance monitored
- Productivity: 3% to 5% improvement in productivity
- Energy and Carbon: 5% to 10% improvement in energy efficiency and carbon emissions
- Asset Utilization: Optimisation of the truck and loader availability and utilization
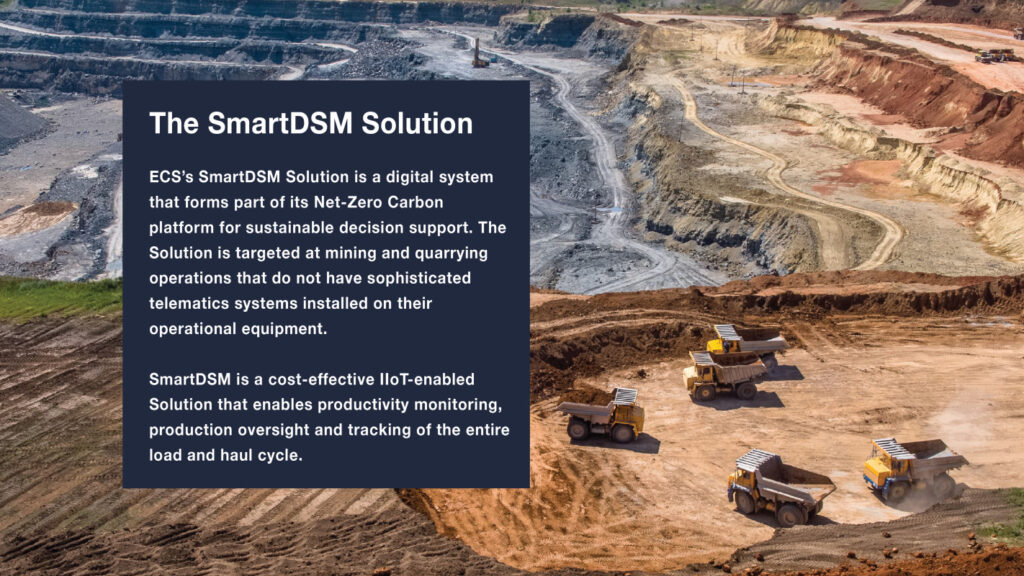
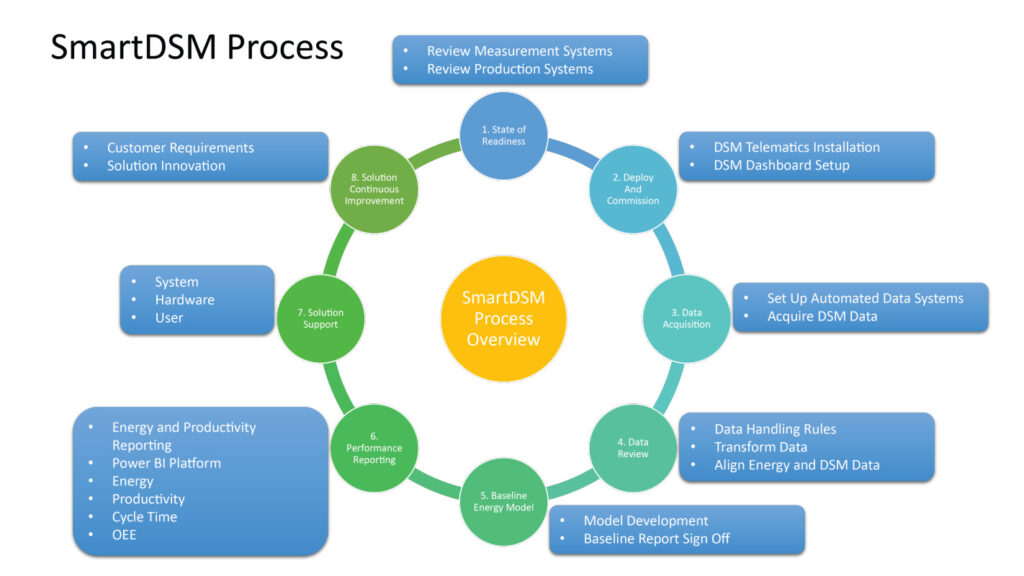
SmartDSM - Sustainable Decision Support
SmartDSM is a cost-effective, IIoT-enabled solution that
enables sustainable decision support through:
- Production and energy data collection using IIoT-enabled technology
- Monitoring and tracking of equipment showing live location
- Load and haul cycle reporting including cycle time, payload, and distance travelled
- Expected energy and cycle time reporting to inform operational performance.
- Comparison of equipment performance within fleets.
- Energy efficiency improvement and related carbon emissions reduction
- Health and Safety compliance
SmartDSM is designed for mining operations without
sophisticated telematics systems on their equipment.
SmartDSM Live Equipment Tracking Dashboard
Geospatial View:
• Provides a real-time map displaying the location of
equipment on site, enabling easy tracking and
monitoring. Speed & Fuel Percentage:
• Current speed & remaining
fuel in the tank Current Status:
• real-time status of equipment,
indicating operating, idling,
stopped, or parked 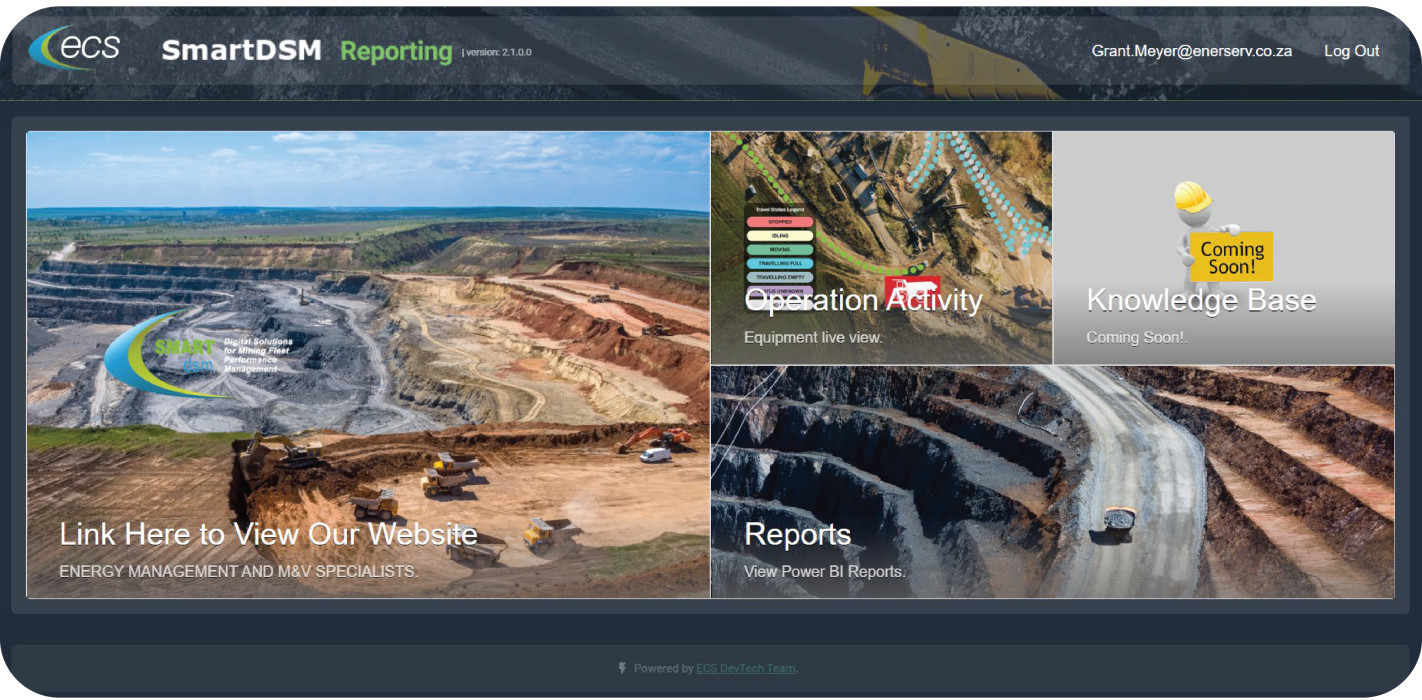
SmartDSM Reporting Performance Summary
Operating Time
Tracks how long equipment is actively
working, helping to optimize usage and
reduce downtime. Fuel
Monitors fuel consumption to control costs and improve fuel efficiency. Energy & Carbon
Measures energy usage and carbon emissions, supporting sustainability and
environmental goals. 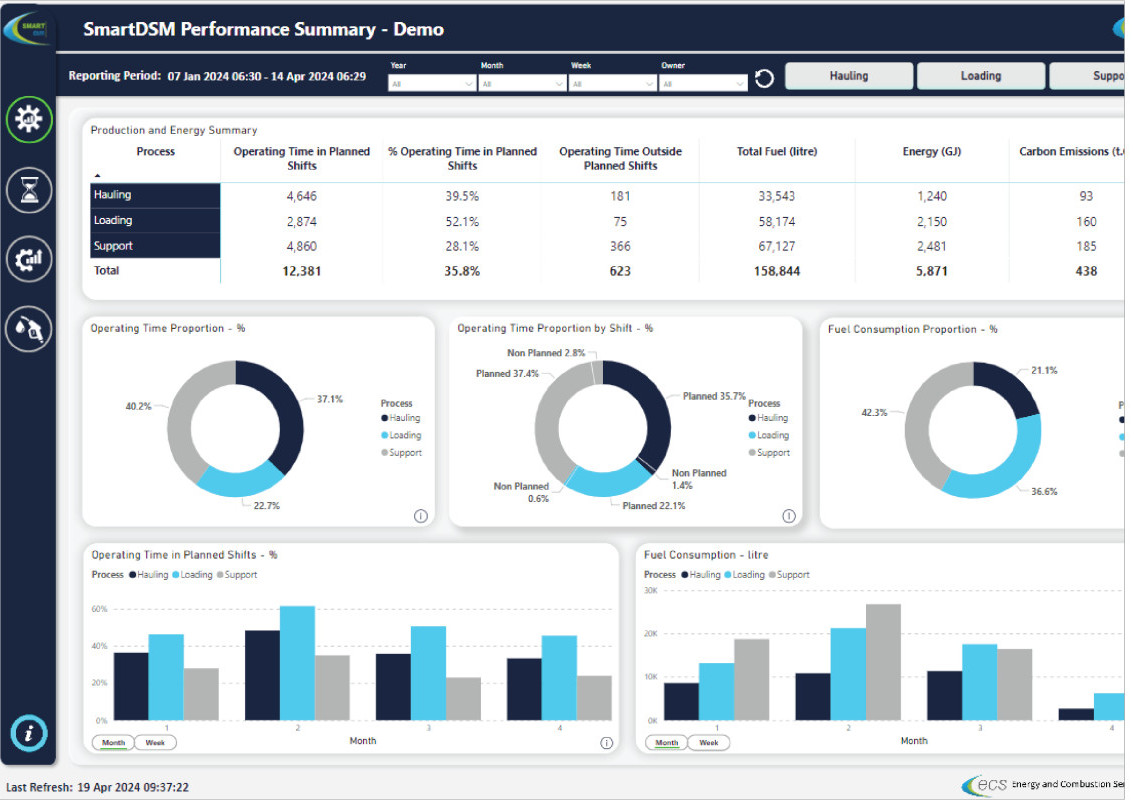
SmartDSM Reporting Operating Time
Operating Time Breakdown:
Analyzes equipment in operation
during specific periods, providing insight into how time is spent across various tasks. Operating Inside and Outside of
Shifts:
Monitors equipment performance
both during and outside of scheduled work shifts to identify potential inefficiencies or opportunities for optimization. 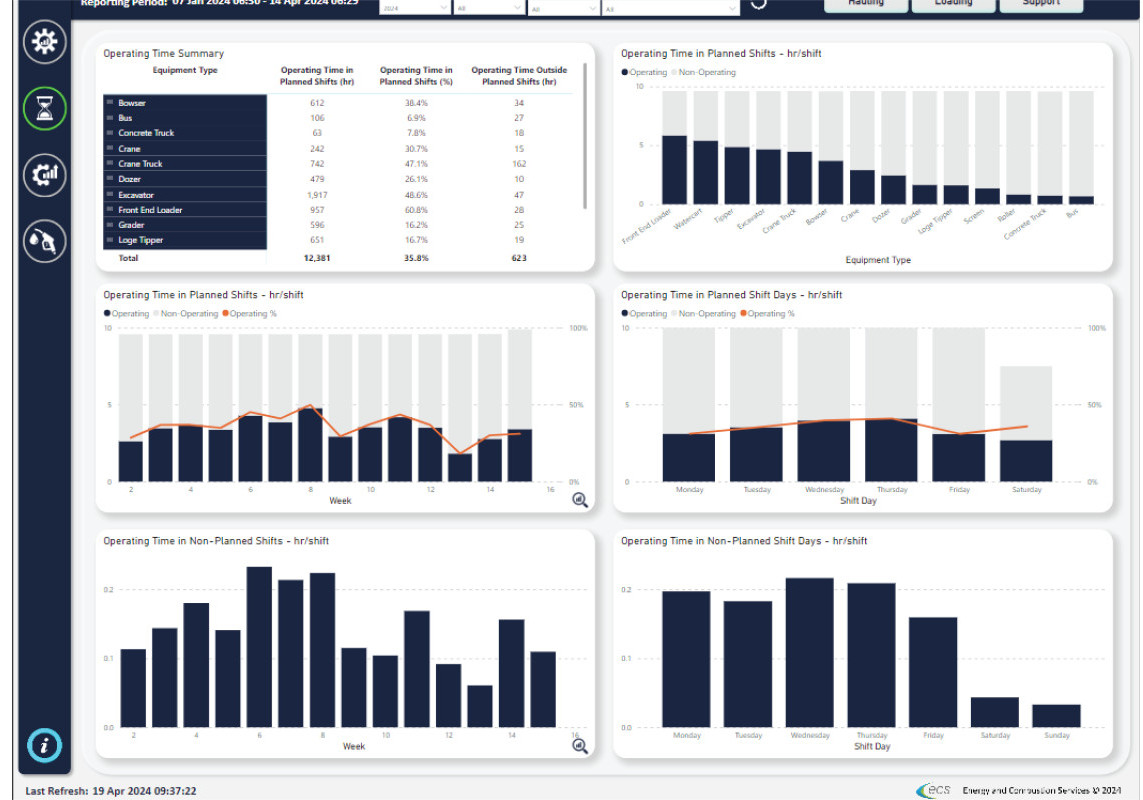
SmartDSM Reporting - Operating Time Continued
Operating Time Component Breakdown:
Categorizes equipment activity into key phases: idle
time, travel full, travel empty, loading, and other
operational tasks. This breakdown helps pinpoint
inefficiencies in specific processes. Temporal/Comparative Performance:
Tracks equipment performance over time, comparing
it across different periods (e.g., daily, weekly,
monthly) to identify trends, deviations, and areas for
improvement. 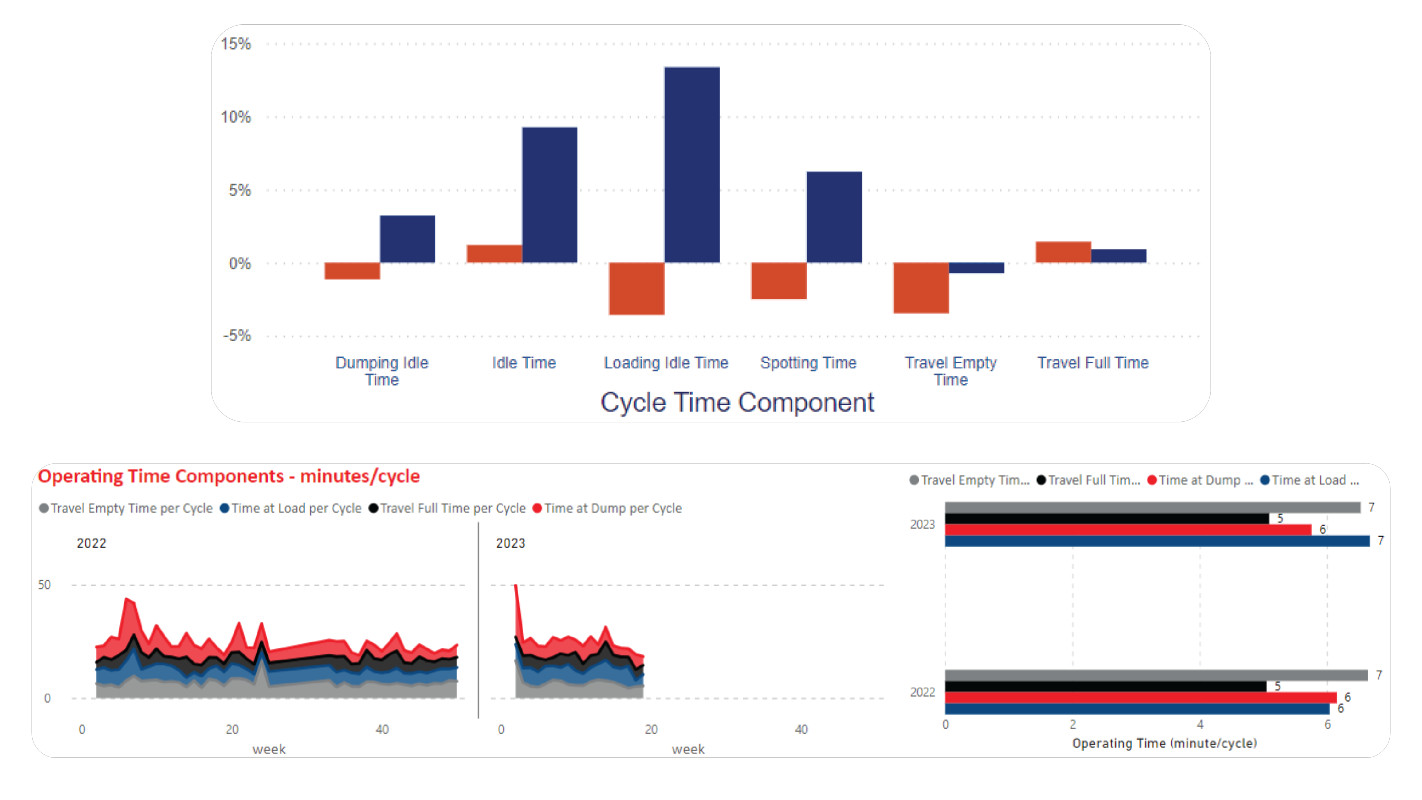
SmartDSM Reporting Fuel Analysis
Total Fuel Consumption by Equipment:
Measures the overall fuel used by each piece of equipment, aiding in cost control
and resource management. Temporal/Comparative Performance:
Tracks equipment performance over time, comparing it across different periods (e.g. daily, weekly, monthly) to identify trends, deviations, and areas for improvement. 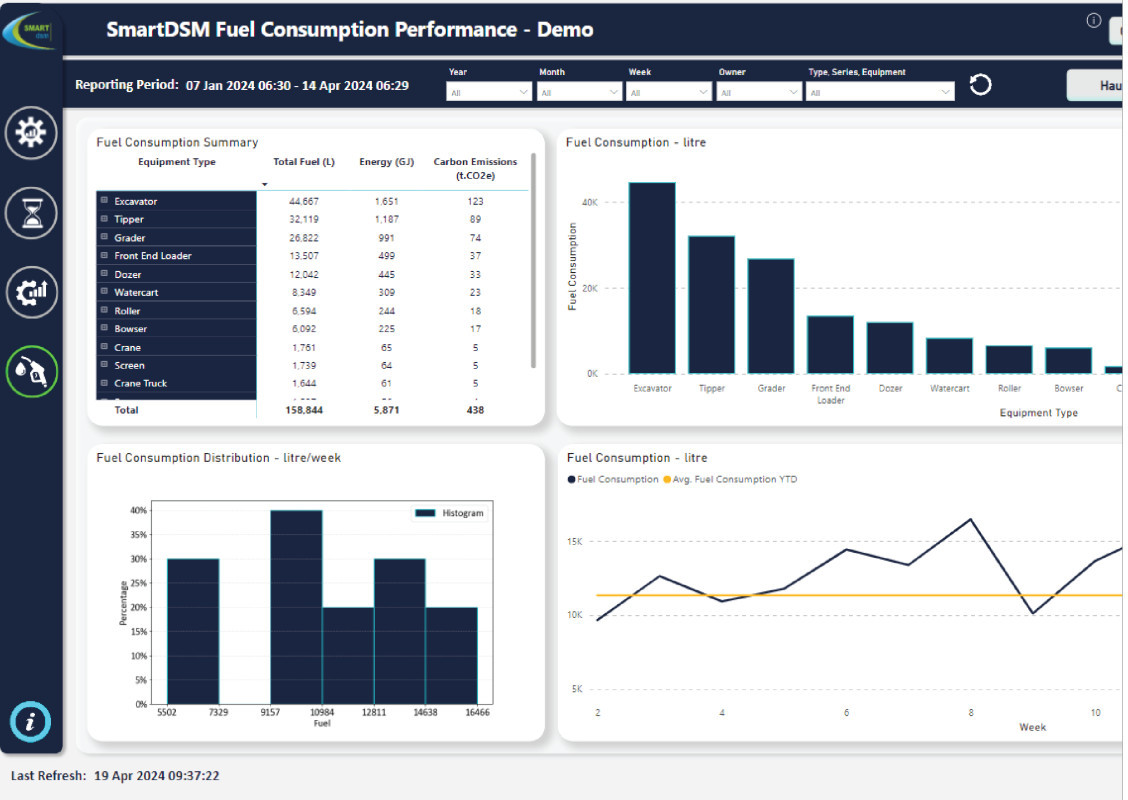
SmartDSM Reporting - Fuel Analysis Continued
Fuel Energy Intensity:
Tracks the energy output per unit of fuel consumed, helping evaluate the efficiency
of fuel usage. Burn Rate:
Monitors the rate at which fuel is consumed during operation, providing insights into equipment efficiency and
performance. Fuel per Cycle:
Calculates the amount of fuel used per operational cycle, enabling performance benchmarking and optimization. 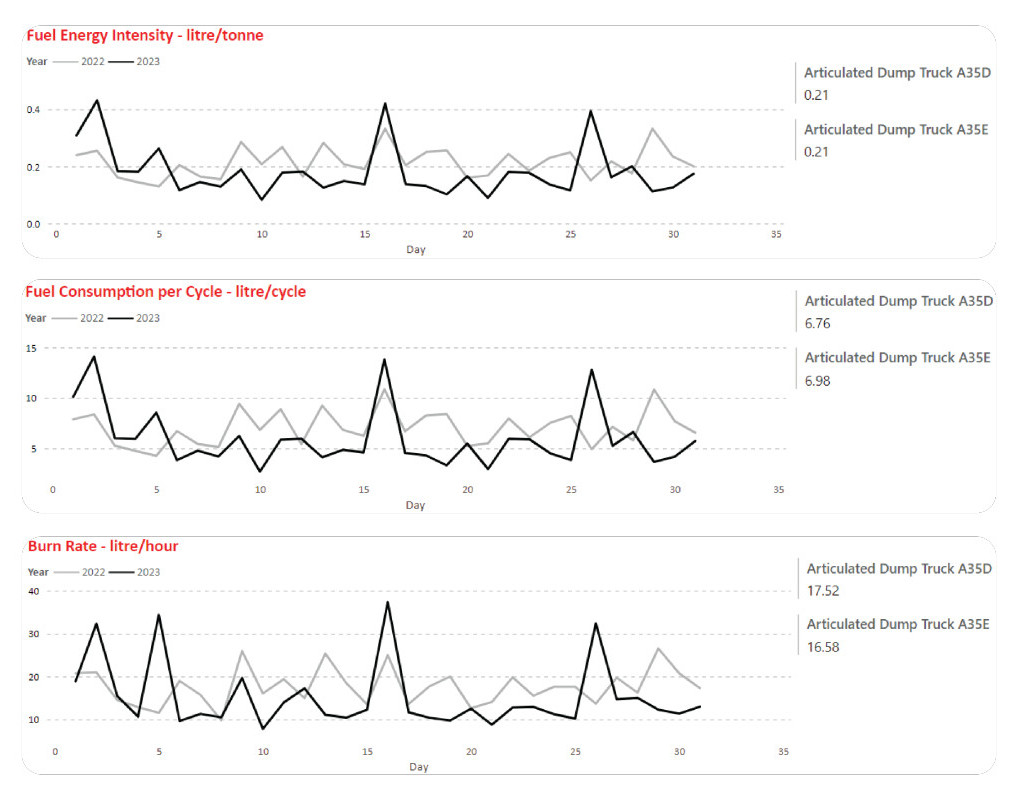
SmartDSM Reporting - Production & Operating Efficiency
Productivity:
Measures the amount of
material moved per hour,
providing insights into
equipment productivity and
efficiency. Payload:
Tracks the weight of material
carried per load, helping assess
equipment capacity utilization. Temporal/Comparative:
Compares productivity metrics
over different periods (e.g.
daily, weekly) to identify trends, performance improvements, or
declines. 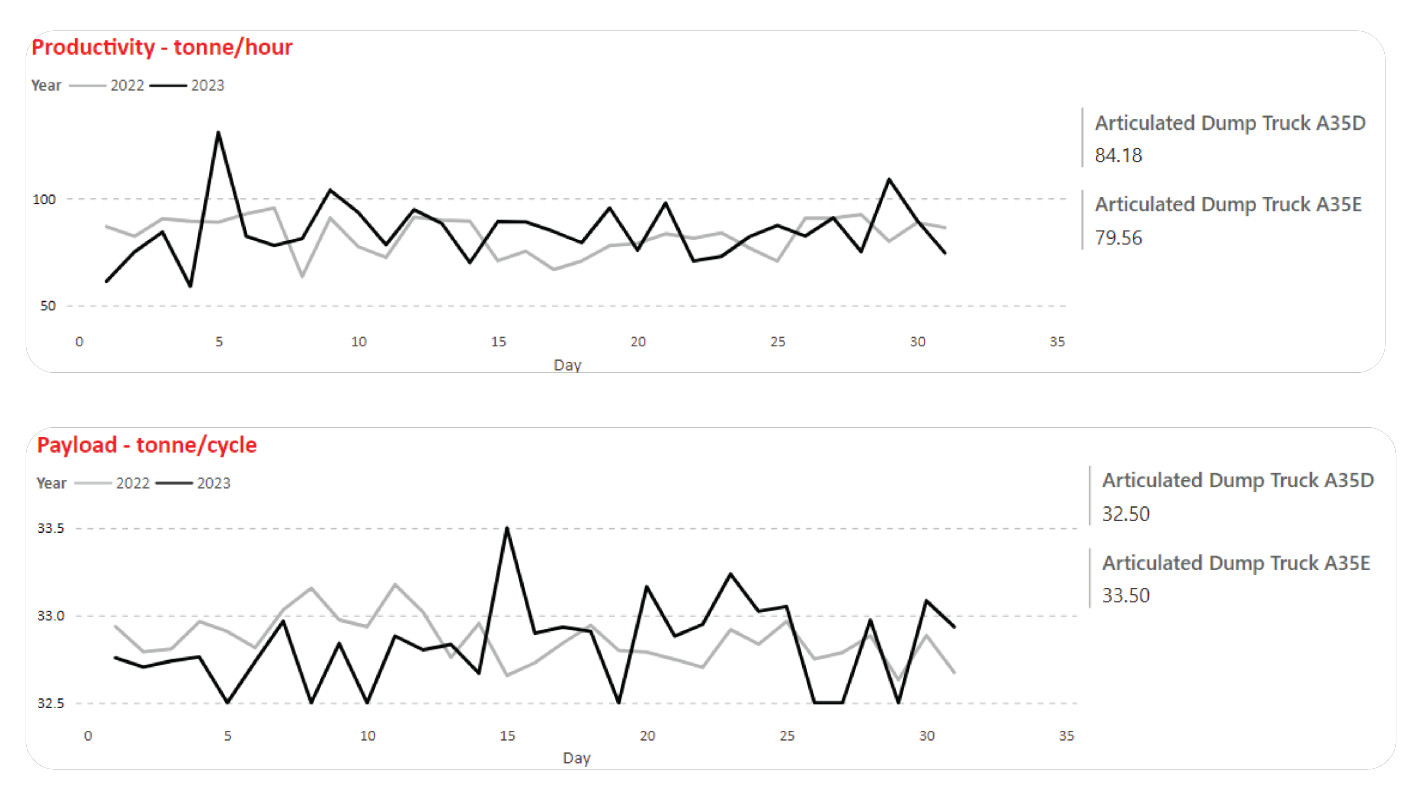
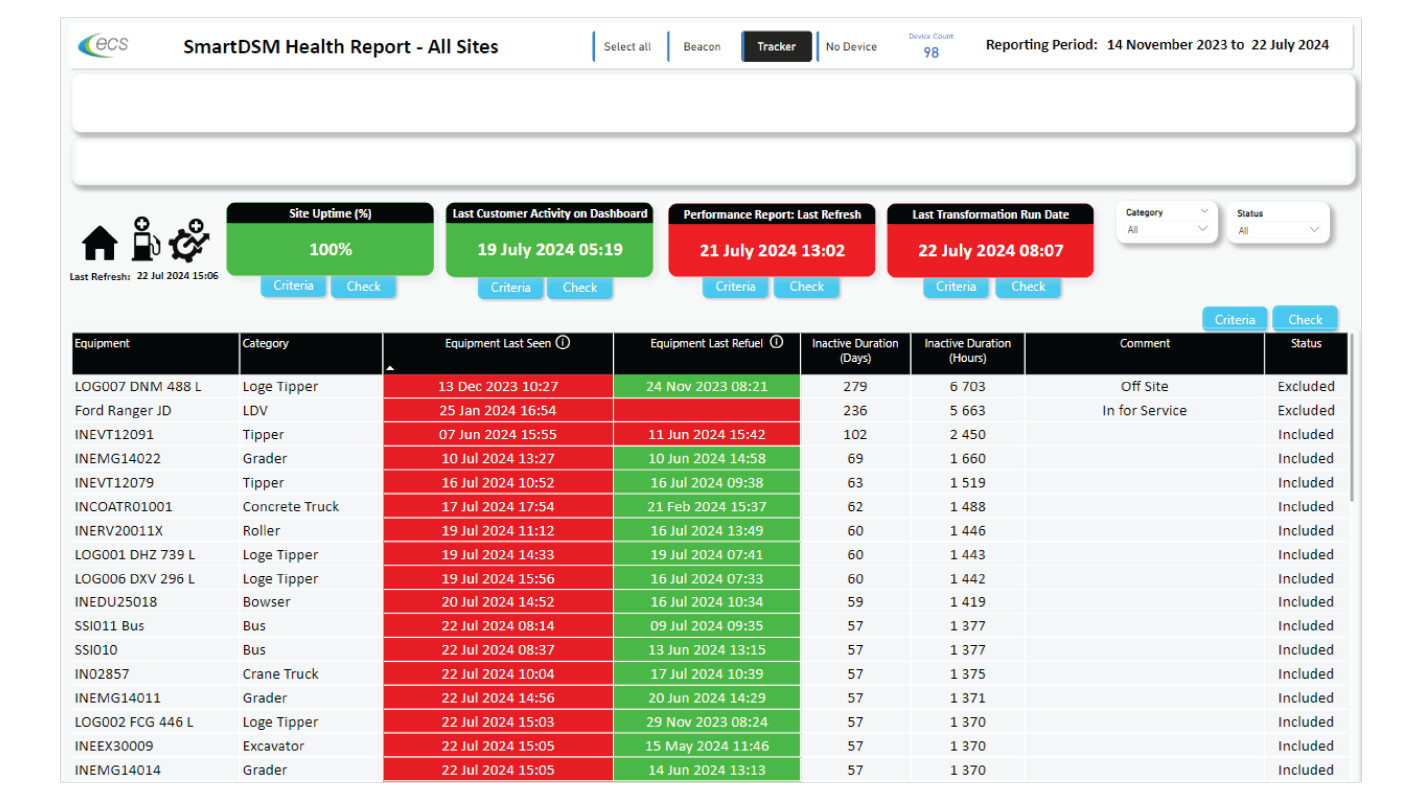
SmartDSM System Health Monitoring
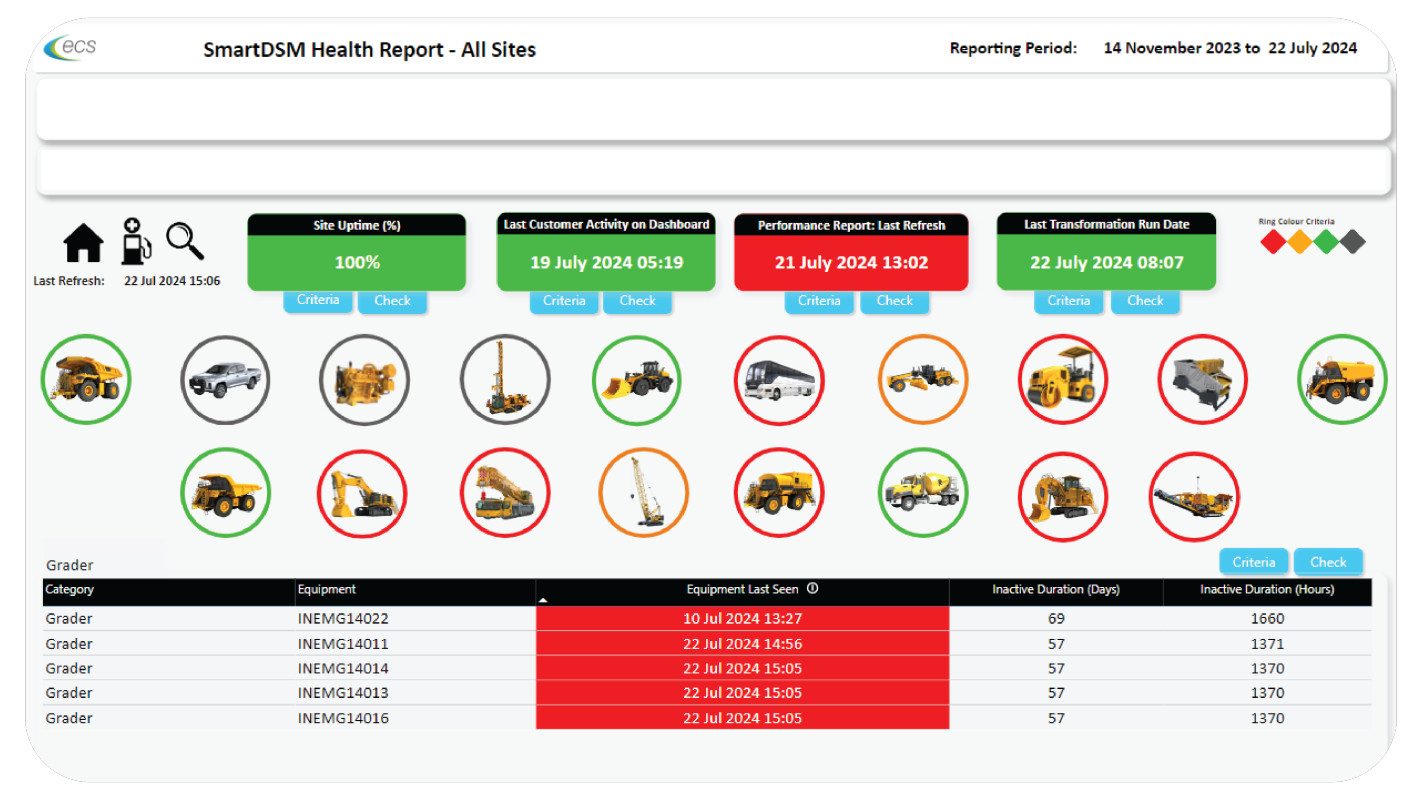
The DSM System Health Report is engineered to focus on monitoring equipment activity with the sole objective of
guaranteeing the effectiveness and precision of trackers. This empowers users to proactively monitor equipment
performance and maintain operational efficiency.
SmartDSM System Health Monitoring
The DSM System Health Report is engineered to focus on monitoring equipment activity with the sole objective of
guaranteeing the effectiveness and precision of trackers. This empowers users to proactively monitor equipment
performance and maintain operational efficiency.
SmartDSM System Health Monitoring Criteria
- 1. Site Uptime: Measures how long the system or site has been operational without interruptions.
- 2. Last Customer Activity: Records the most recent interaction or activity from customers using the system.
- 3. Performance Report Last Refresh: Tracks when the last performance report was updated to ensure data is current.
- 4. Transformation Last Run: Indicates the most recent time data transformations (like ETL processes) were executed successfully.
- 5. Equipment Last Seen: Logs the last time a specific piece of equipment reported status, showing active connectivity.
- 6. Equipment Last Refuel: Captures the most recent refuelling event for equipment to track operational readiness.